
Candlestick charts and trading analytics for brokers and financial websites. Apps for traders.
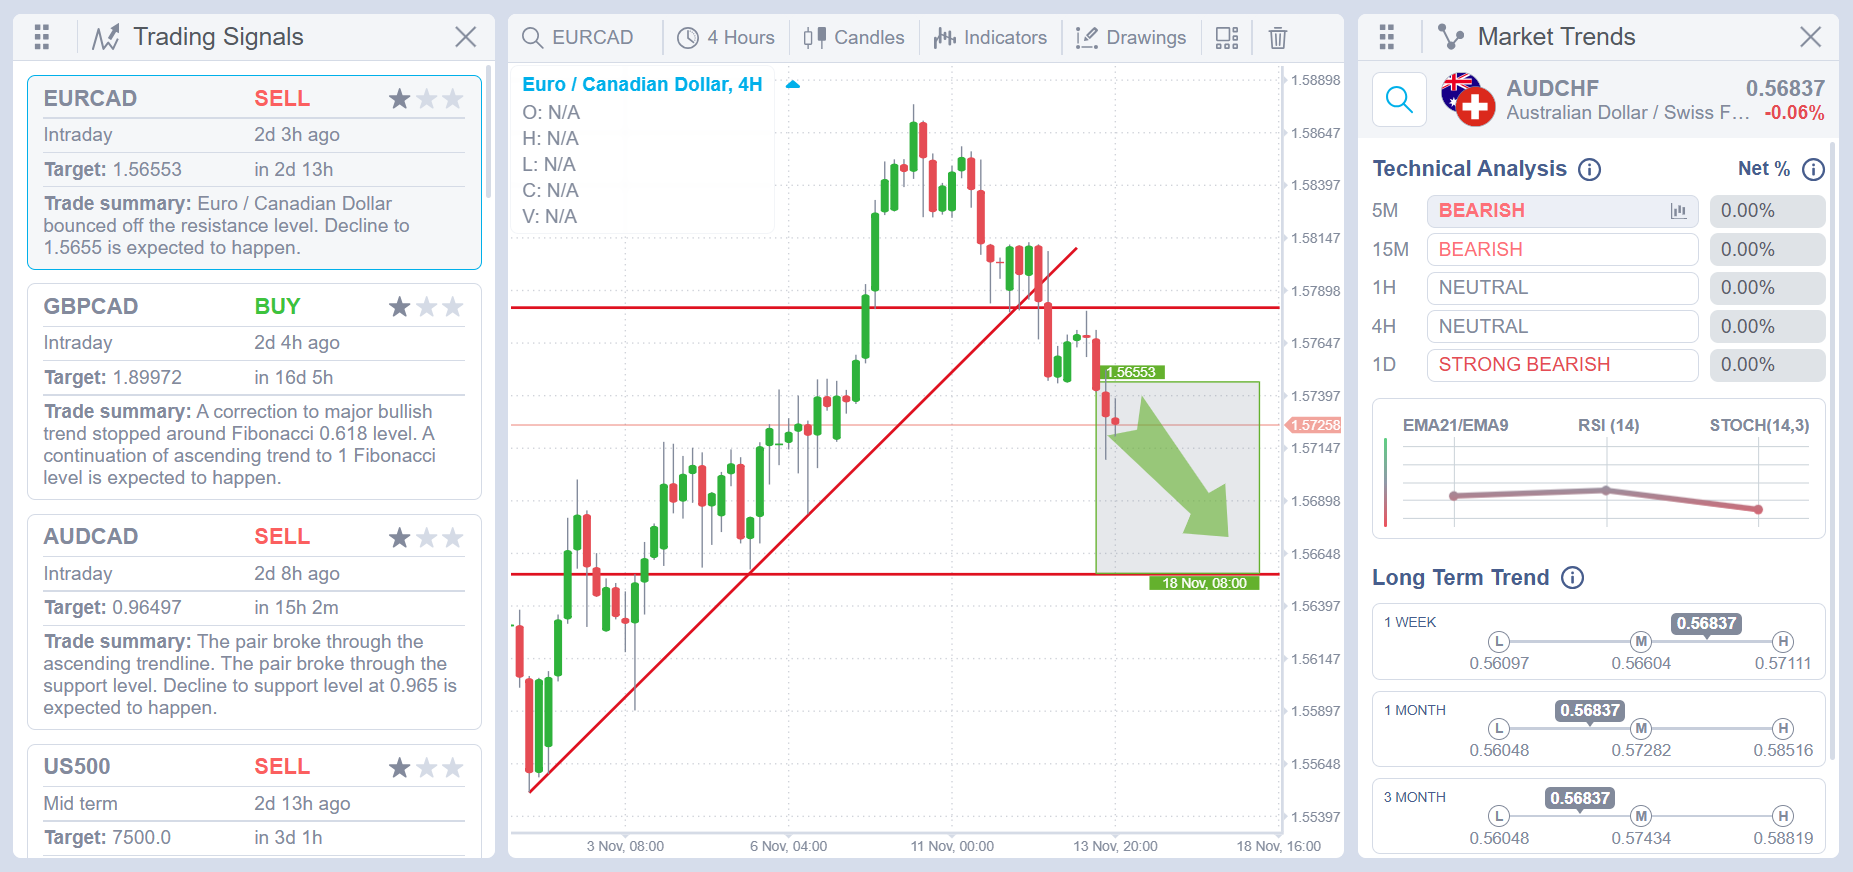
A fast HTML5 candlestick chart library you embed in your own platform or website with one script. Simple for traders, full of tools for professionals.
Connect your own price feed, add your own toolbar buttons and menus, and match the chart to your brand with custom colour themes.
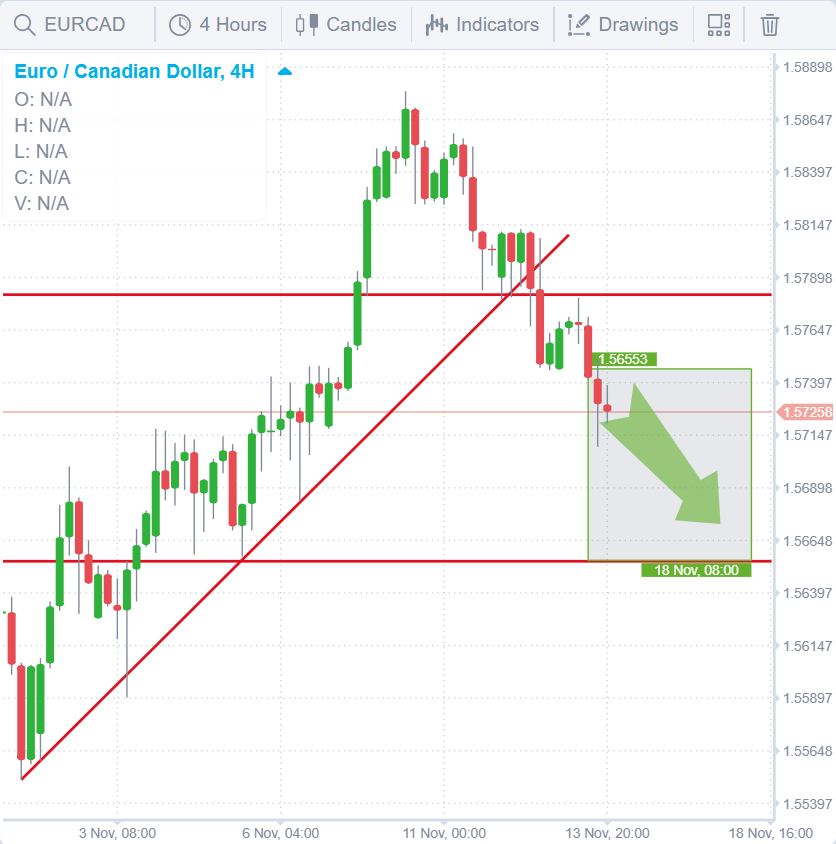
Candles, bars, line and area. Timeframes from 1 tick to 1 week, in any time zone.
RSI, MACD, Bollinger Bands, Ichimoku, Stochastic, Parabolic SAR, Pivot Points, ZigZag and more. Every setting and colour can be changed.
Lines, channels, Fibonacci, Gann, Pitchfork, Head and Shoulders, ABCD, flags, forecasts and trade boxes.
10 layouts, from one chart up to eight on one screen. Layout, theme, language and drawings are restored on reload.
Show positions with entry, take profit and stop loss lines and tags, in your own colours.
Load as a plain script or ES module. Control every chart from code and listen to events: new candles, symbol, layout, indicator and drawing changes.
The full charting library, with all chart types, indicators and drawing tools, is only 430 KB.
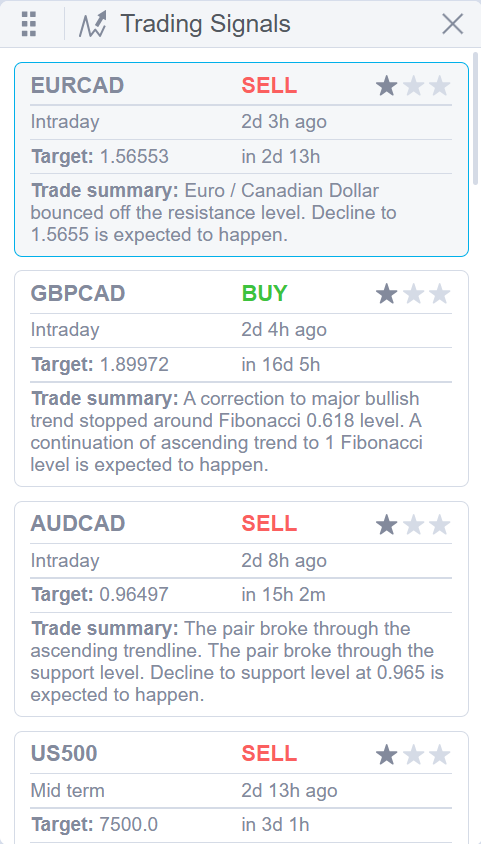
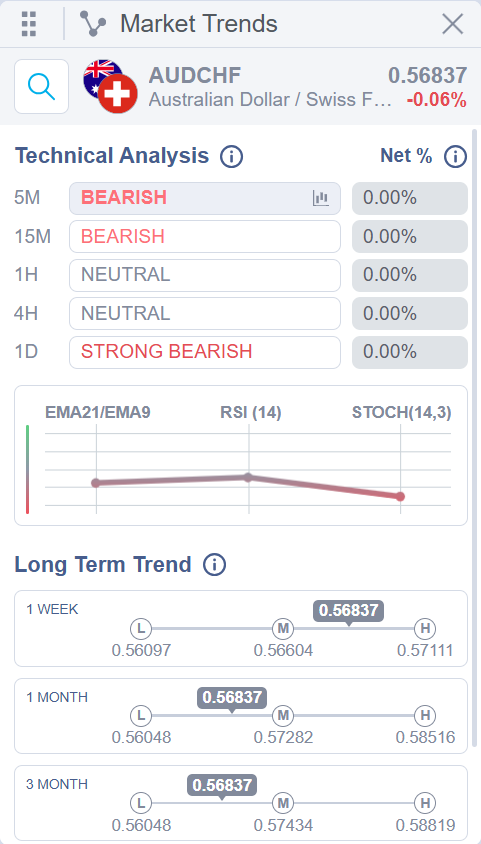
Ready-made trading signals and market trends for your clients, on your website or inside your platform, in your brand.
Every signal comes with a target, a time frame and a short trade summary, and opens on the chart in one click.
Buy and sell ideas with target, time frame and trade summary, drawn right on the chart.
RSI (14), Stochastic (14, 3, 3) and EMA 9/21 combined into one rating, from Strong Bearish to Strong Bullish, on 5 time frames.
Price change over five periods on a 7-colour scale, and where the price sits between its week, month, 3-month and year highs and lows.
ServeMe, our own HTTP/WebSocket framework on Dart. No third-party middleware between your clients and the data.
PackMe, similar to FlatBuffers but slightly faster. No memory allocation while encoding, and the browser reads data straight into objects with no JSON overhead.
MongoDB with raw aggregation pipelines, time-bucketed grouping and custom indexes. No ORM layer to slow it down.
cTrader Open API over WebSocket and Protobuf, with automatic reconnects, request matching and many parallel subscriptions.
Firebase authentication with scoped access tokens. Google Sign-In, OAuth2 and email/password.
Svelte 5 and SvelteKit with server and client rendering, and our own Canvas 2D chart engine. No external UI dependencies.
You can build a chart library with AI. Making it fast, correct and stable is the hard part: testing, edge cases and bug fixing.
Our charting library source code has already been through that. Our price is lower than building and testing a chart library of the same quality yourself.
Market Trends finds the strongest trend on the market in a few seconds. It scans the most popular forex pairs and metals live, so you see everything you need at a glance.
Free to download on iPhone and Android.


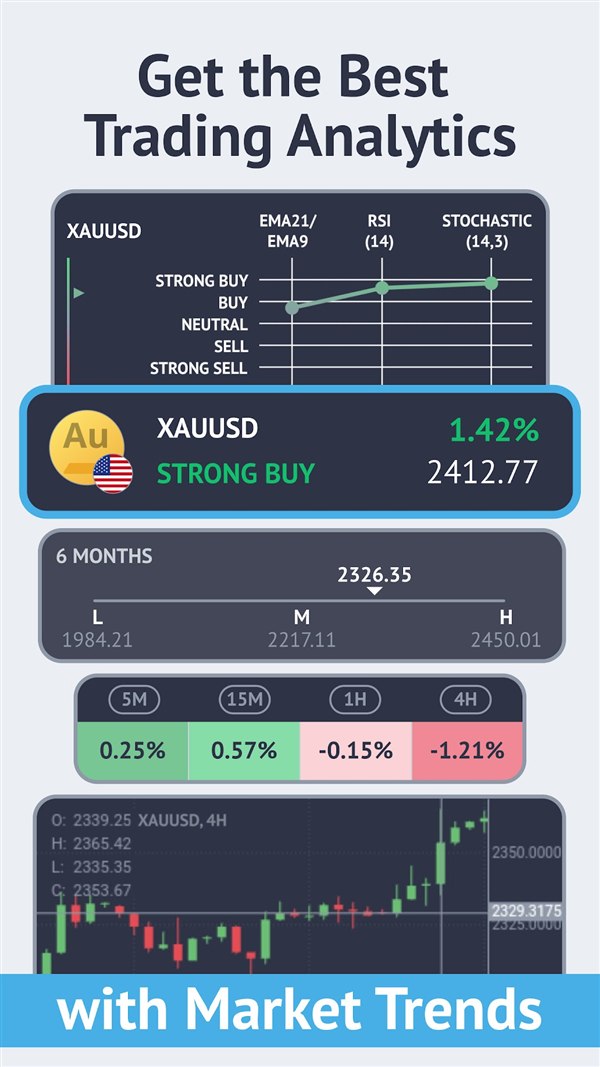
Scans forex pairs, gold and silver live and shows where the trend is strongest.
Built on 3 popular indicators: EMA 21/9 difference, RSI (14) and Stochastic (14, 3, 3).
Signal strength per indicator, with one tap to the candlestick chart to verify the trend.
Pivot levels calculated live for every asset and time frame: another view on continuation or reversal.
Set your own signal levels for each indicator, so the tool works the way you trade.
Forex signals, a "Chat on chart" traders community and a personal algo builder.
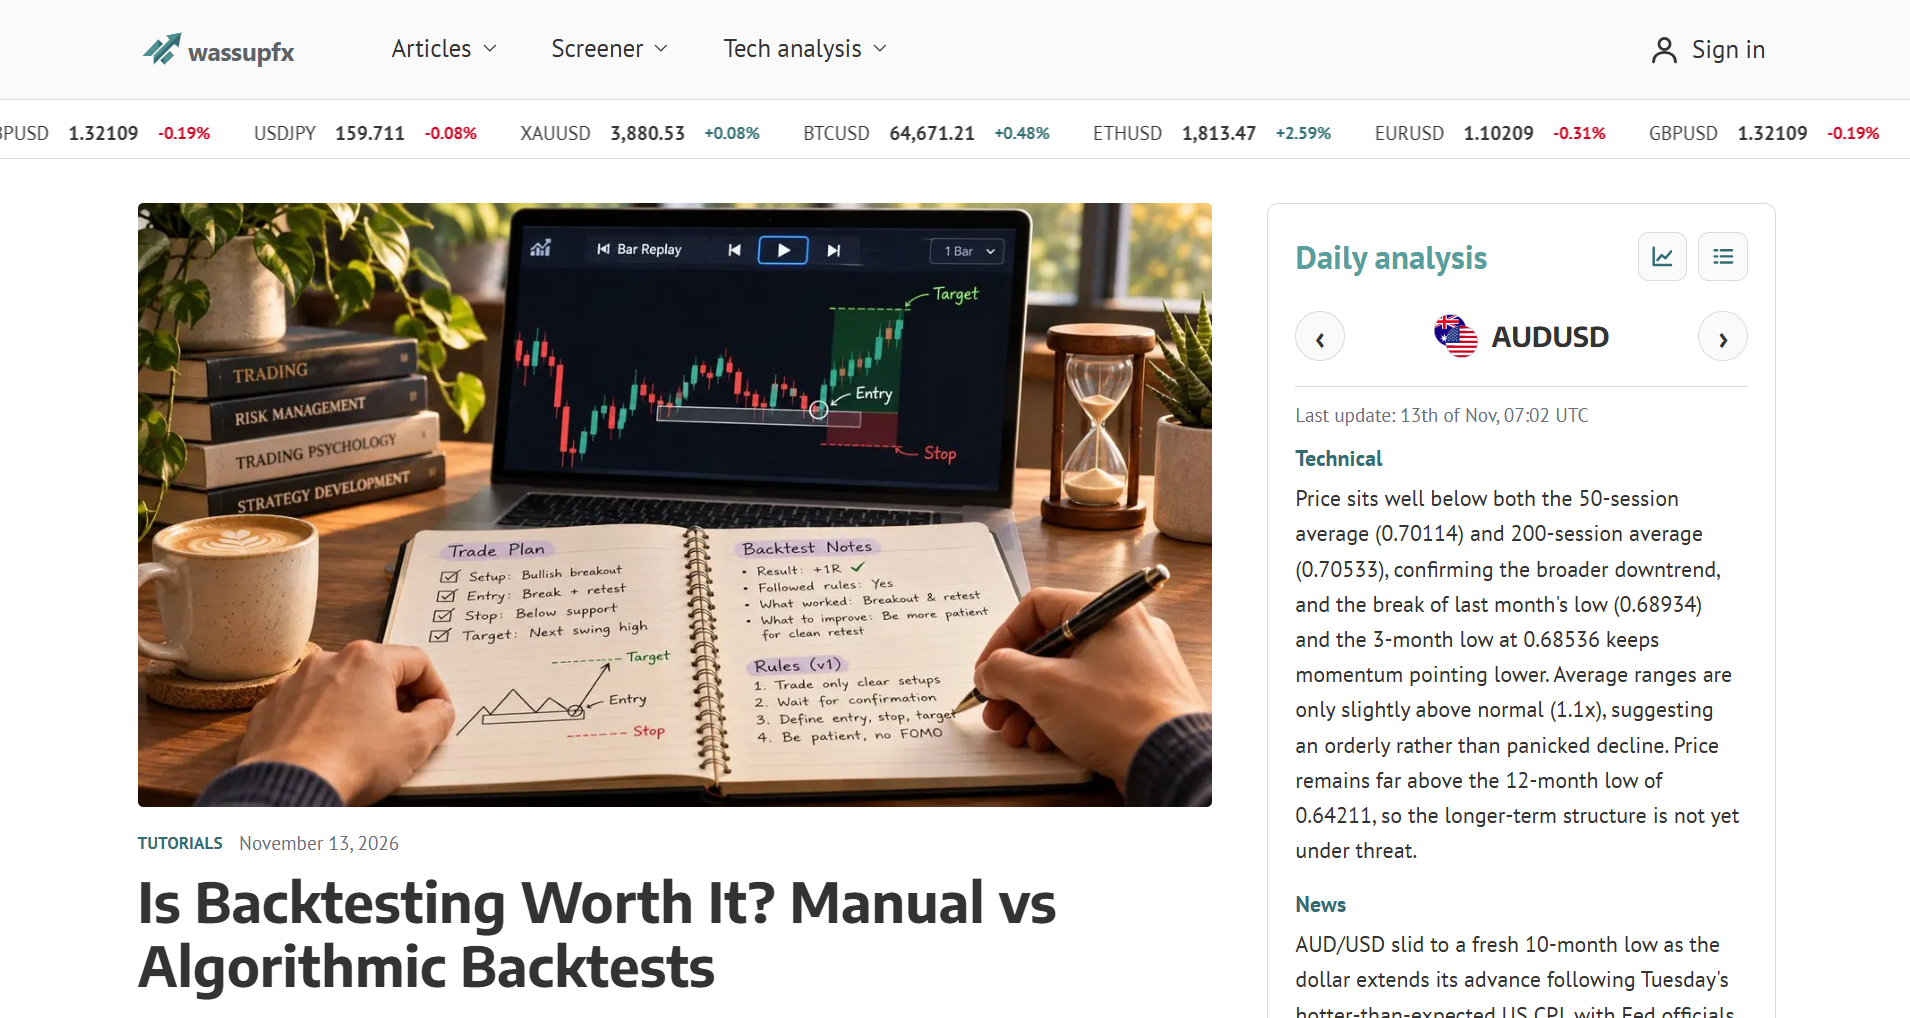
Forex and market analysis for traders: daily technical analysis, market reviews and articles, in one place.
Technical picture and the news behind it, for each major symbol.
Chart patterns with lines, entry and target drawn on the chart.
Market reviews, tutorials and trading articles.
Free live screener: trend strength and volatility for currency pairs, stock indices, gold, oil and crypto on one map, updated every 10 seconds.